
Modern agents don’t run in isolation. A single user interaction can fan out across APIs, background workers, and eventually return as a proactive notification — often asynchronously. When something goes wrong (or just gets slow), the hardest question isn’t what happened, but where it happened. That’s where distributed tracing becomes essential.
Agents SDK v1.5 adds first-class support for OpenTelemetry. This post walks through a sample that puts it to work across three services, and shows how proactive messaging fits naturally into the same trace.
These features are not just additive—they remove two common sources of complexity when building observable agent systems.
OpenTelemetry bootstrap (manual instrumentation.ts)
Each service bootstraps OpenTelemetry through a dedicated instrumentation.ts module that is preloaded before index.ts using Node's --import flag. This gives full control over exporters, metric intervals, and shutdown handlers — without relying on @microsoft/agents-telemetry or auto-instrumentation packages. Propagation across service boundaries is handled explicitly via inject/extract calls, which is the main pattern this sample demonstrates.
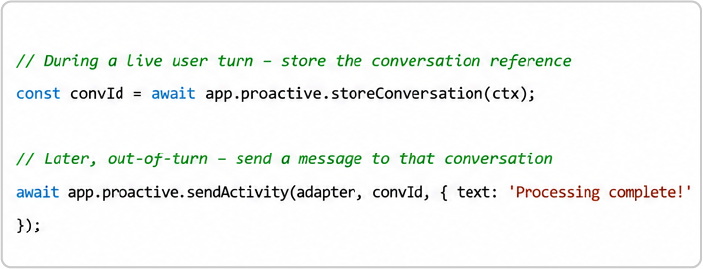
Proactive messaging (AgentApplication.proactive)
Sending a message outside of an active user turn used to require managing conversation references manually. The v1.5 SDKremoves the need for manual conversation reference handling, making proactive messaging a first-class capability:
These two features pair well: you can kickoff async work, trace it end-to-end, and deliver results back to the user proactively.
This example uses a simple end-to-end scenario across three services:
Three services. One trace. One place to understand the full lifecycle.
This is especially relevant in systems where agents orchestrate multiple services, handle asynchronous workflows, or integrate with external APIs.
The hardest part of distributed tracing is not instrumentation — it’s trace context propagation across service boundaries.
OpenTelemetry uses the W3C Trace Context standard: a trace parent header carries the traceId and spanId from one service to the next. When the trace parent header is missing (or not forwarded),each service starts a new trace. That’s why your waterfall disappears.
Most tracing issues in distributed systems are not caused by missing instrumentation, but by missing propagation.
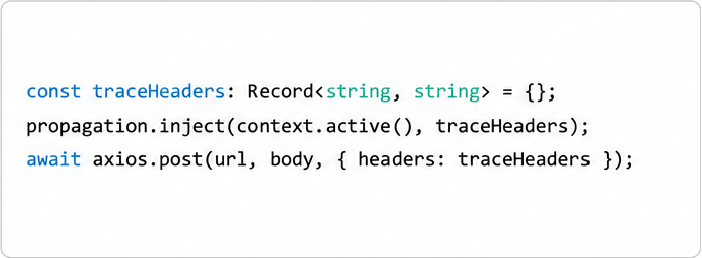
Inject on the way out:
Extract on the way in:
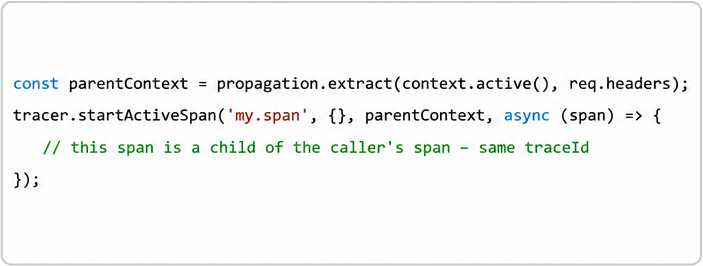
This is a small amount of code — but it is what makes a unified trace possible. If you're new to OpenTelemetry and yourtraces appear fragmented across services, this is almost certainly the reason.
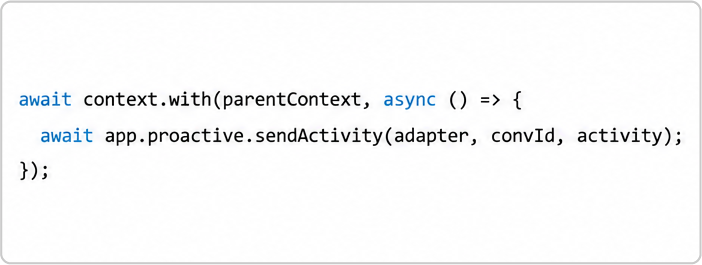
For the proactive send — which happens outside any active HTTP handler — the extracted context is passed through context.with() so those spans still join the right trace:
This pattern reflects scenarios we’ve encountered when building multi-service agent systems in production environments.
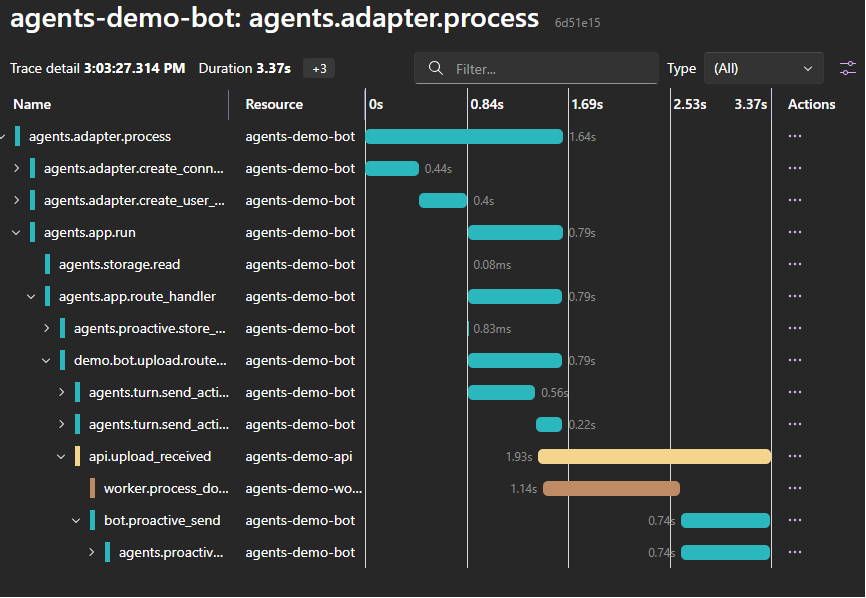
A single traceId spanning bot, API, and worker, including the proactive message — even across asynchronous boundaries.
All spans across the three services share the same traceId, forming a single trace instead of disconnected fragments. Eachspan exposes duration, attributes, and errors — turning what would otherwise beguesswork into traceable, debuggable behavior.
The sample also includes:
Proactive messaging is common in real agent workloads: long‑running operations, background processing, delayed responses.Without trace continuity, these workflows become difficult to debug and reason about.
The pattern shown here ensures that:
For architects, this turns async agent workflows into something you can reason about as a single transaction boundary—even when execution is distributed.
If you're working on multi-service agents, background processing, or proactive messaging scenarios, the best way to understand this pattern is to run it and inspect the traces directly.
Clone the repo, run the services, and trigger a few upload commands from the Agents Playground. Then open AspireDashboard and follow the trace.
The full source code is available here: https://github.com/southworks/agents-sdk-v15-otel-proactive